Portfolio
Portfolio
Portfolio
Web Designer Portfolio Highlights
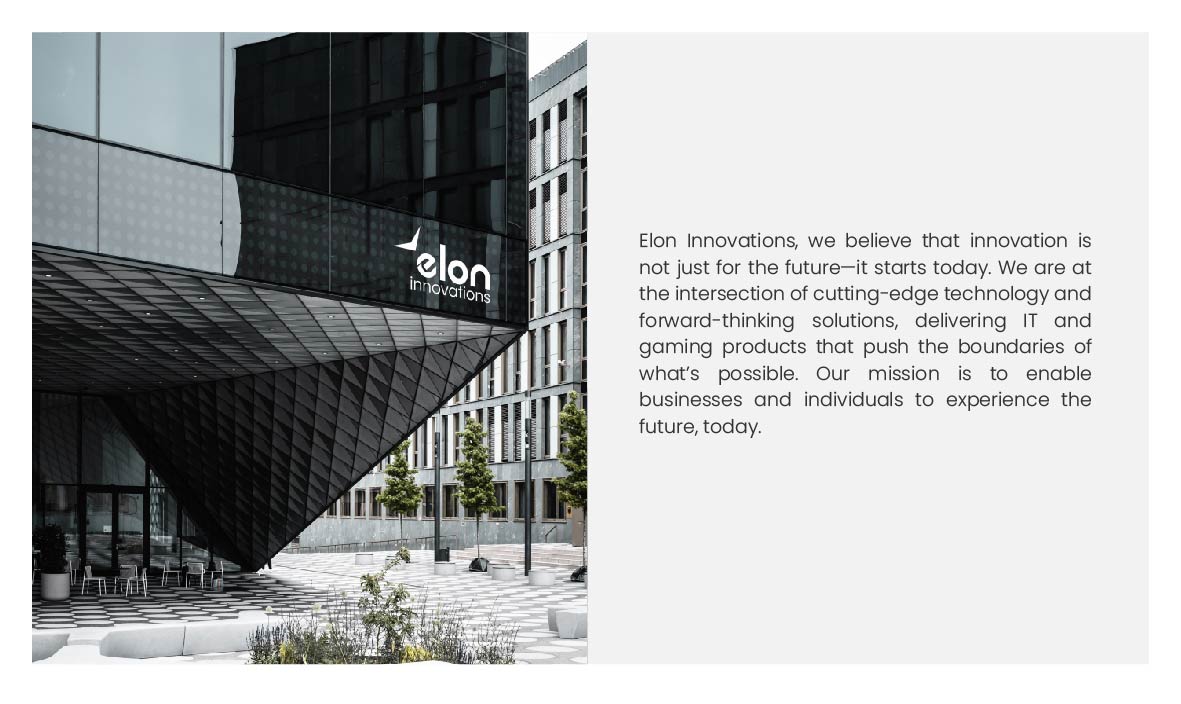
Welcome to our Dubai web designer portfolio. We are a Dubai-based creative team focused on elevating your digital footprint. Our expertise lies in crafting SEO-optimized websites, executing successful social media marketing strategies, and delivering results-driven design solutions. We empower Dubai businesses to grow through comprehensive digital marketing services, including SEO optimization, Google Ads management, and content-driven campaigns. Our showcased projects highlight genuine success for clients across various UAE industries. Whether you’re a startup or an expanding brand, our Dubai digital marketing services are designed for measurable ROI. Review our work to see how we transform digital strategies into tangible business growth.
Why Choose Us?
Ready to elevate your brand online? With over 8 years of specialized experience in the dynamic world of web design and digital marketing, we empower Dubai-based businesses to achieve remarkable online growth. We build more than just websites; we create powerful digital assets engineered for success. Our proven approach includes strategic SEO implementation, beautiful and functional responsive web design, and expertly designed conversion-focused websites that drive leads and sales. Every project showcased in our web design portfolio is a testament to our dedication to quality and impactful results. Let’s discuss how we can bring your unique vision to life with a website that ranks prominently and consistently converts for your UAE brand!
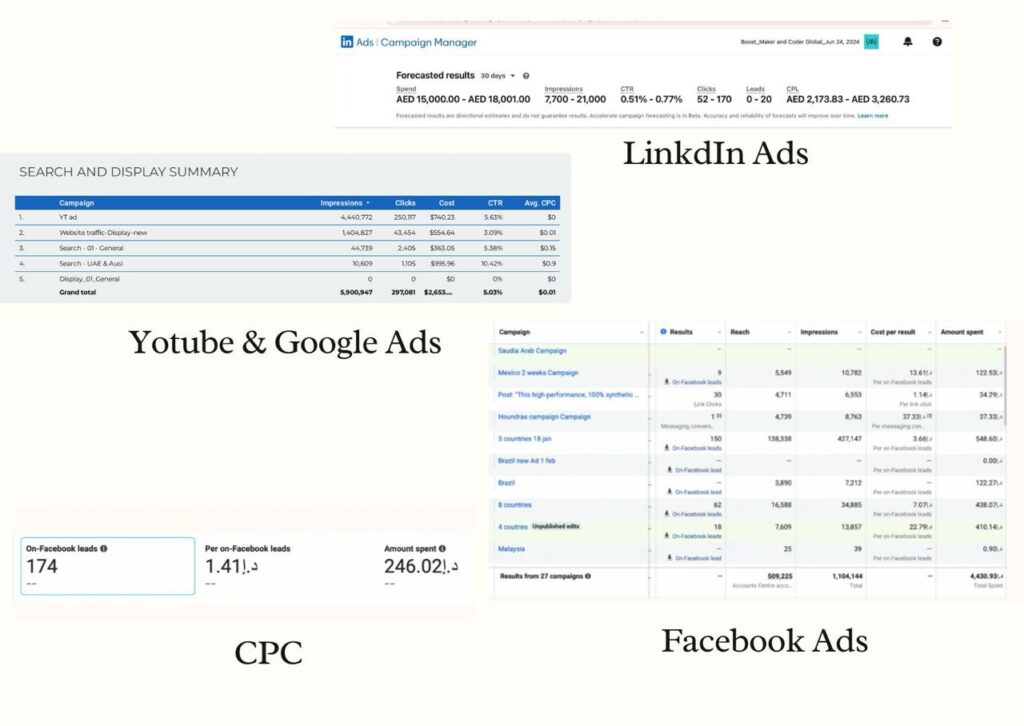
Results of web designer portfolio
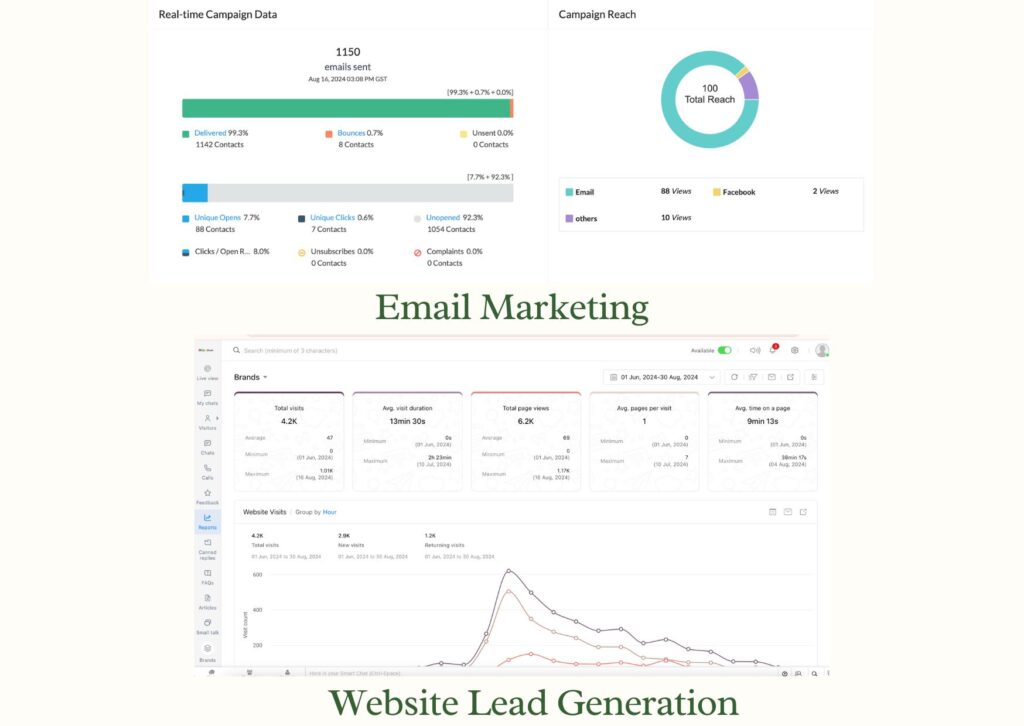
In the competitive Dubai market, results are everything. That’s why our performance marketing solutions are built on a foundation of measurable success. Whether it’s through expertly managed Google Ads campaigns, strategic PPC advertising, or intelligent social media retargeting, we specialize in connecting Dubai businesses with their ideal customers. Our goal is clear: to generate highly qualified leads and maximize your return on investment (ROI). Take a look at our showcased performance marketing case studies to see firsthand how our Dubai digital marketing agency transforms clicks into conversions and strategies into substantial business growth.
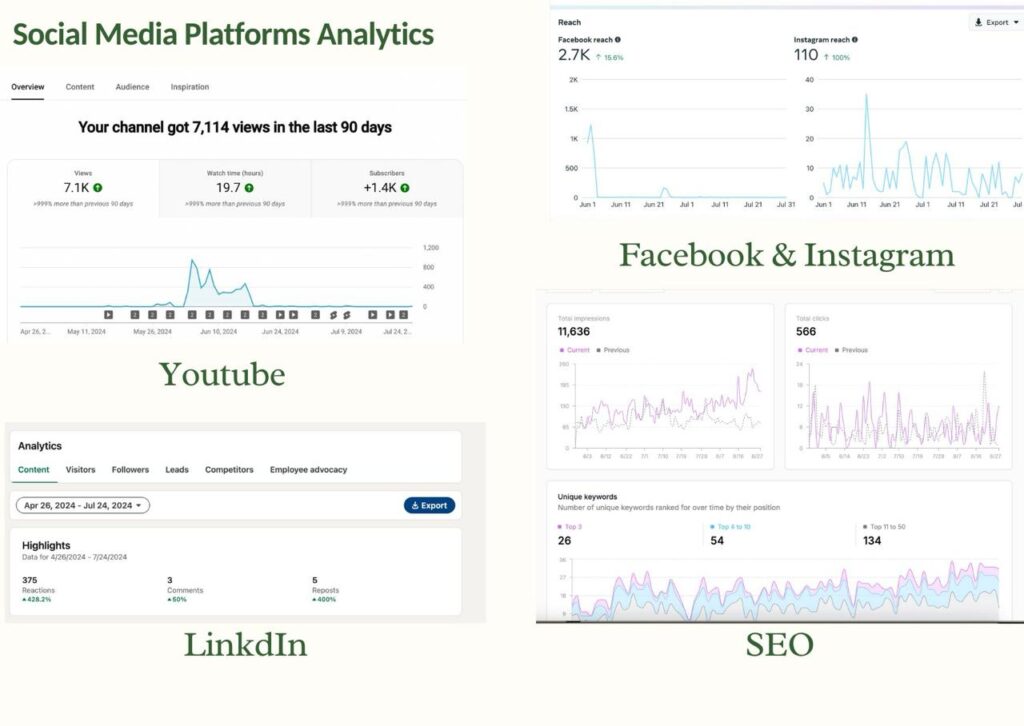
Total Impressions
11,636
Unique keywords
Number of unique keywords ranked for over time by their position
Tabs
Portfolio Analyzer
Portfolio Growth
Your portfolio performance over time
Asset Allocation
Current portfolio distribution
Holdings
Individual asset performance
| Asset | Allocation | Value | Return |
|---|---|---|---|
|
AAPL
Apple Inc.
|
15.2% | $19,128 | +12.5% |
|
MSFT
Microsoft Corp.
|
12.8% | $16,109 | +18.3% |
|
GOOGL
Alphabet Inc.
|
10.5% | $13,214 | -2.1% |
|
TSLA
Tesla Inc.
|
8.3% | $10,445 | +25.7% |
|
BTC
Bitcoin
|
6.2% | $7,802 | +45.2% |
|
VTI
Vanguard Total Stock
|
22.0% | $27,686 | +9.8% |
Risk Metrics Explanation
Standard Deviation (11.2%)
Measures the volatility of your portfolio returns. Lower values indicate more stable returns.
Maximum Drawdown (-23.4%)
The largest peak-to-trough decline in your portfolio value. Shows worst-case scenario losses.
Sharpe Ratio (1.24)
Risk-adjusted return measure. Higher values indicate better risk-adjusted performance.
Sortino Ratio (1.67)
Similar to Sharpe ratio but focuses only on downside risk, providing a more accurate measure of risk-adjusted returns.
Correlation Matrix
Asset correlation analysis
| AAPL | MSFT | GOOGL | TSLA | BTC | |
|---|---|---|---|---|---|
| AAPL | 1.00 |
0.75 |
0.68 |
0.45 |
0.12 |
| MSFT | 0.75 |
1.00 |
0.82 |
0.38 |
0.08 |
| GOOGL | 0.68 |
0.82 |
1.00 |
0.42 |
0.15 |
| TSLA | 0.45 |
0.38 |
0.42 |
1.00 |
0.28 |
| BTC | 0.12 |
0.08 |
0.15 |
0.28 |
1.00 |
Correlation Analysis
Correlation values range from -1 to 1. Values closer to 1 indicate assets move together, while values closer to -1 indicate they move in opposite directions. Values near 0 suggest little correlation.
Key Insights: Tech stocks (AAPL, MSFT, GOOGL) show high correlation, indicating they tend to move together. Bitcoin shows low correlation with traditional assets, making it a good diversification tool.
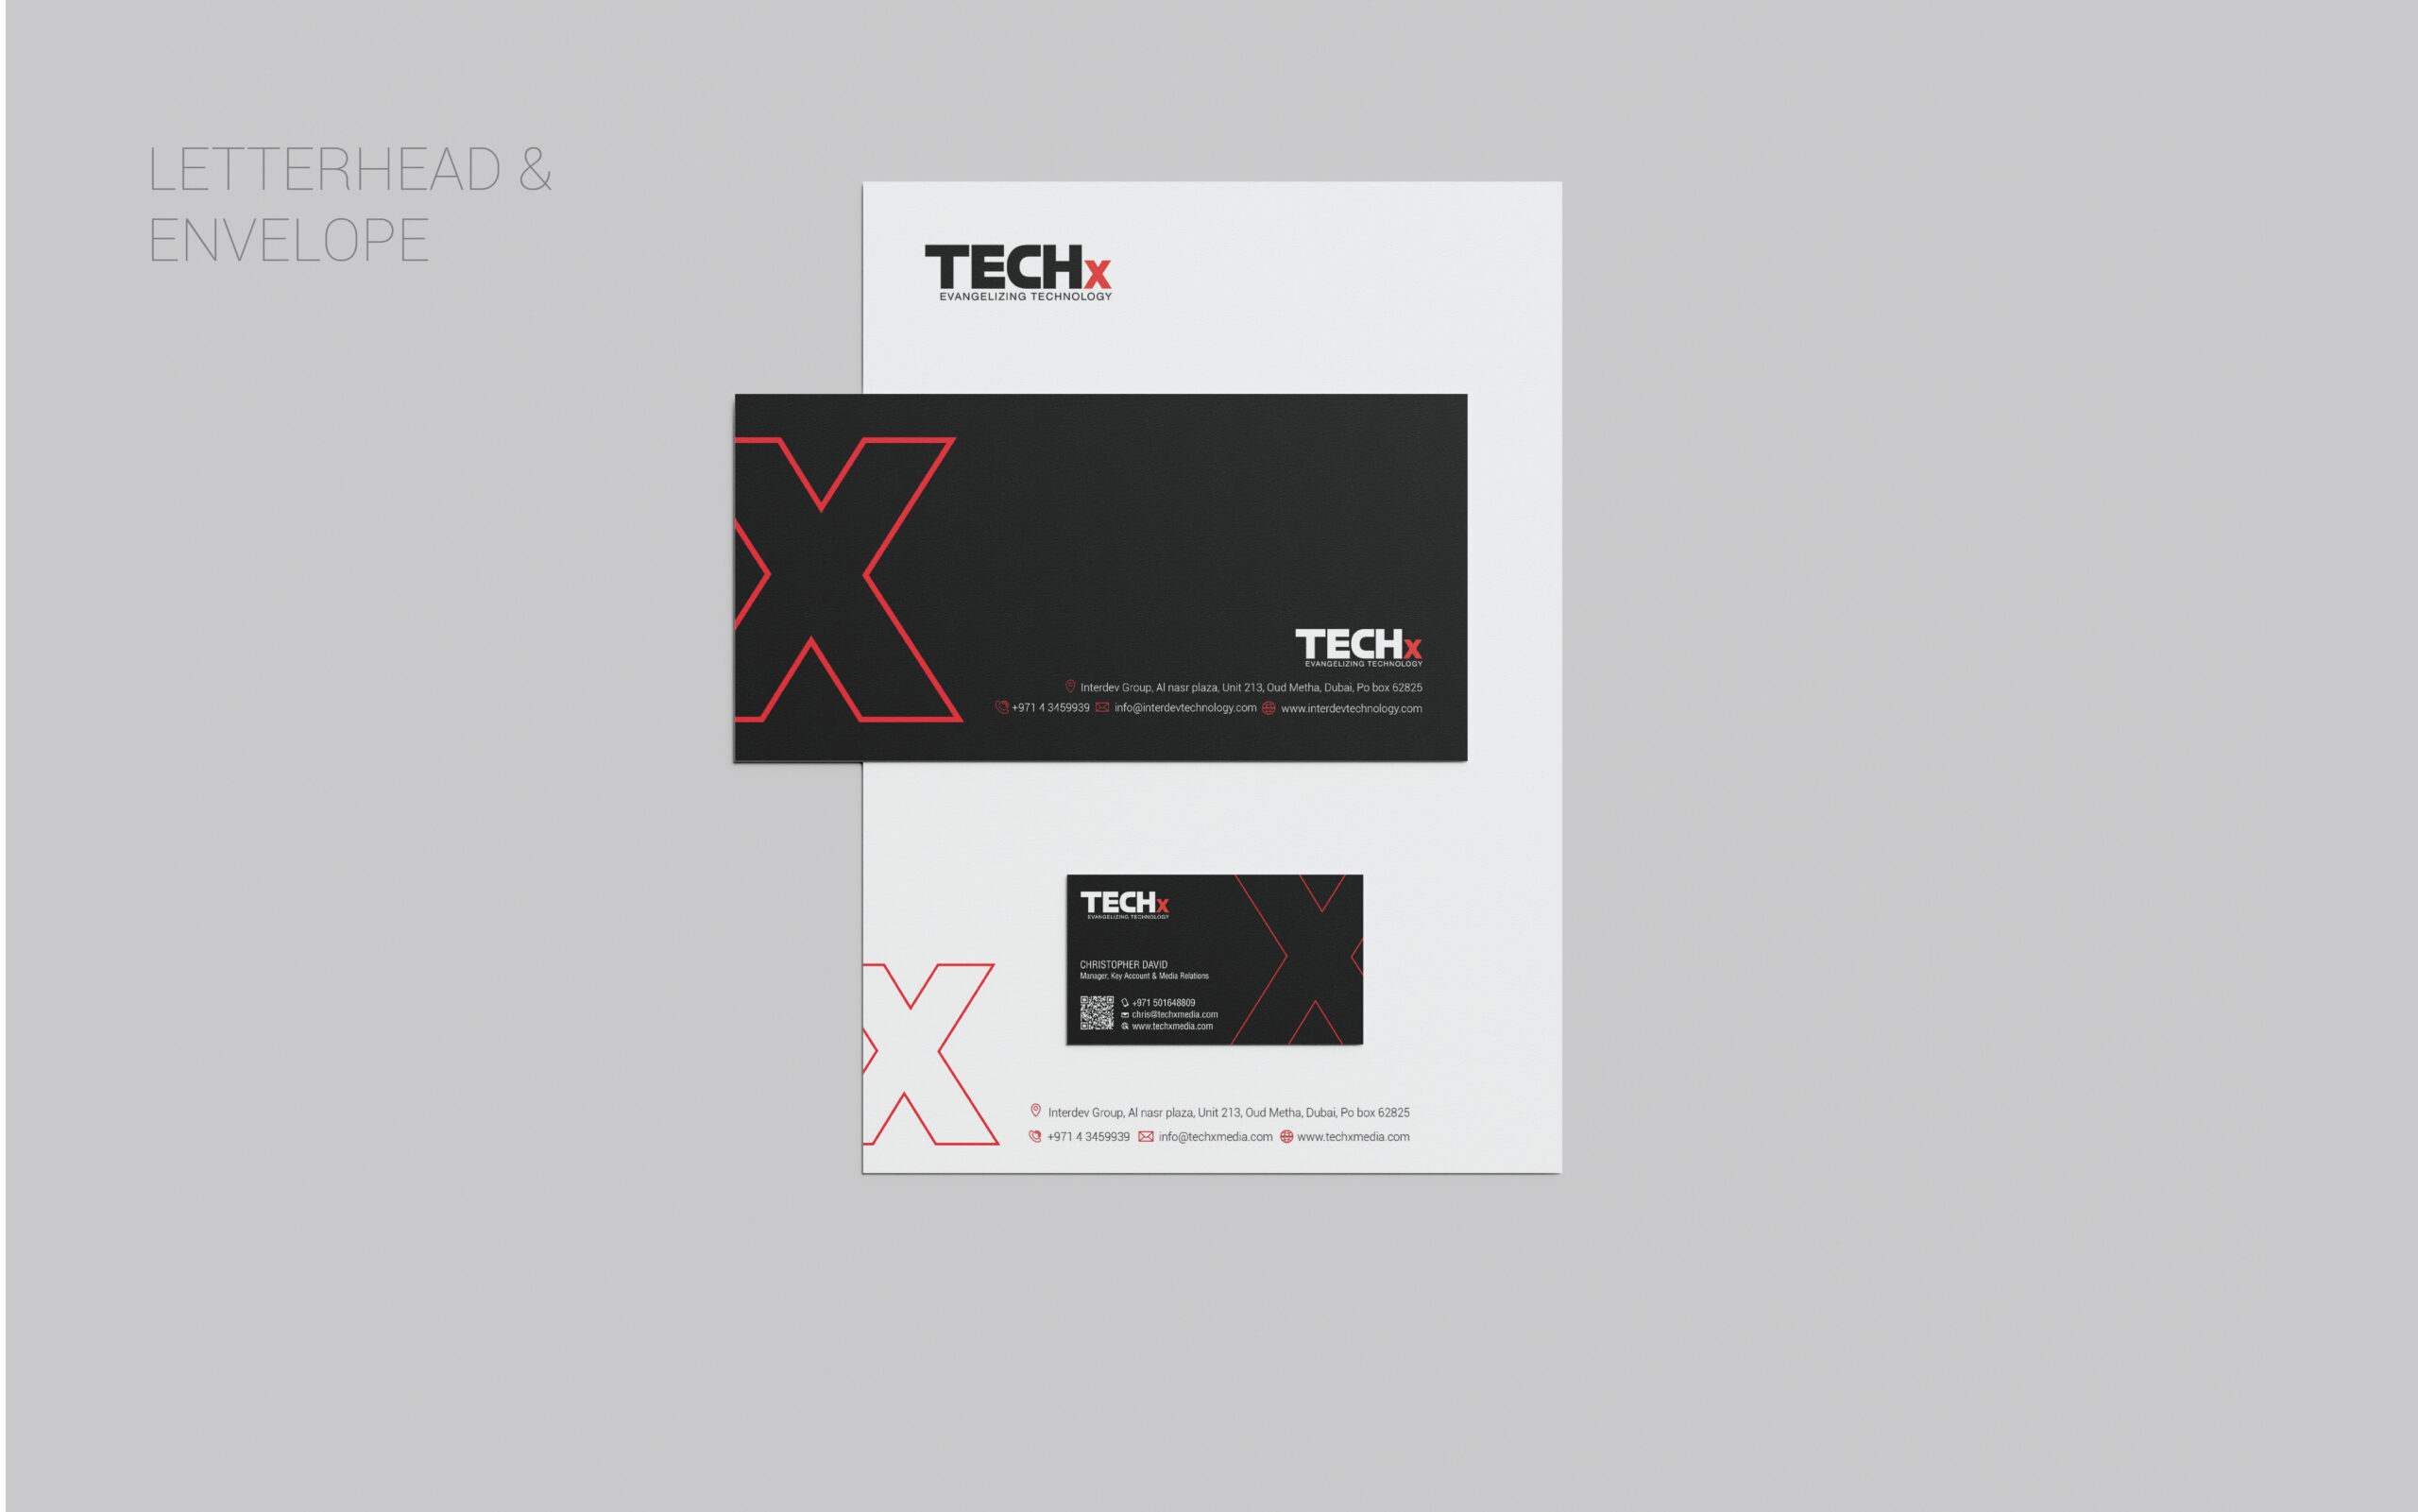
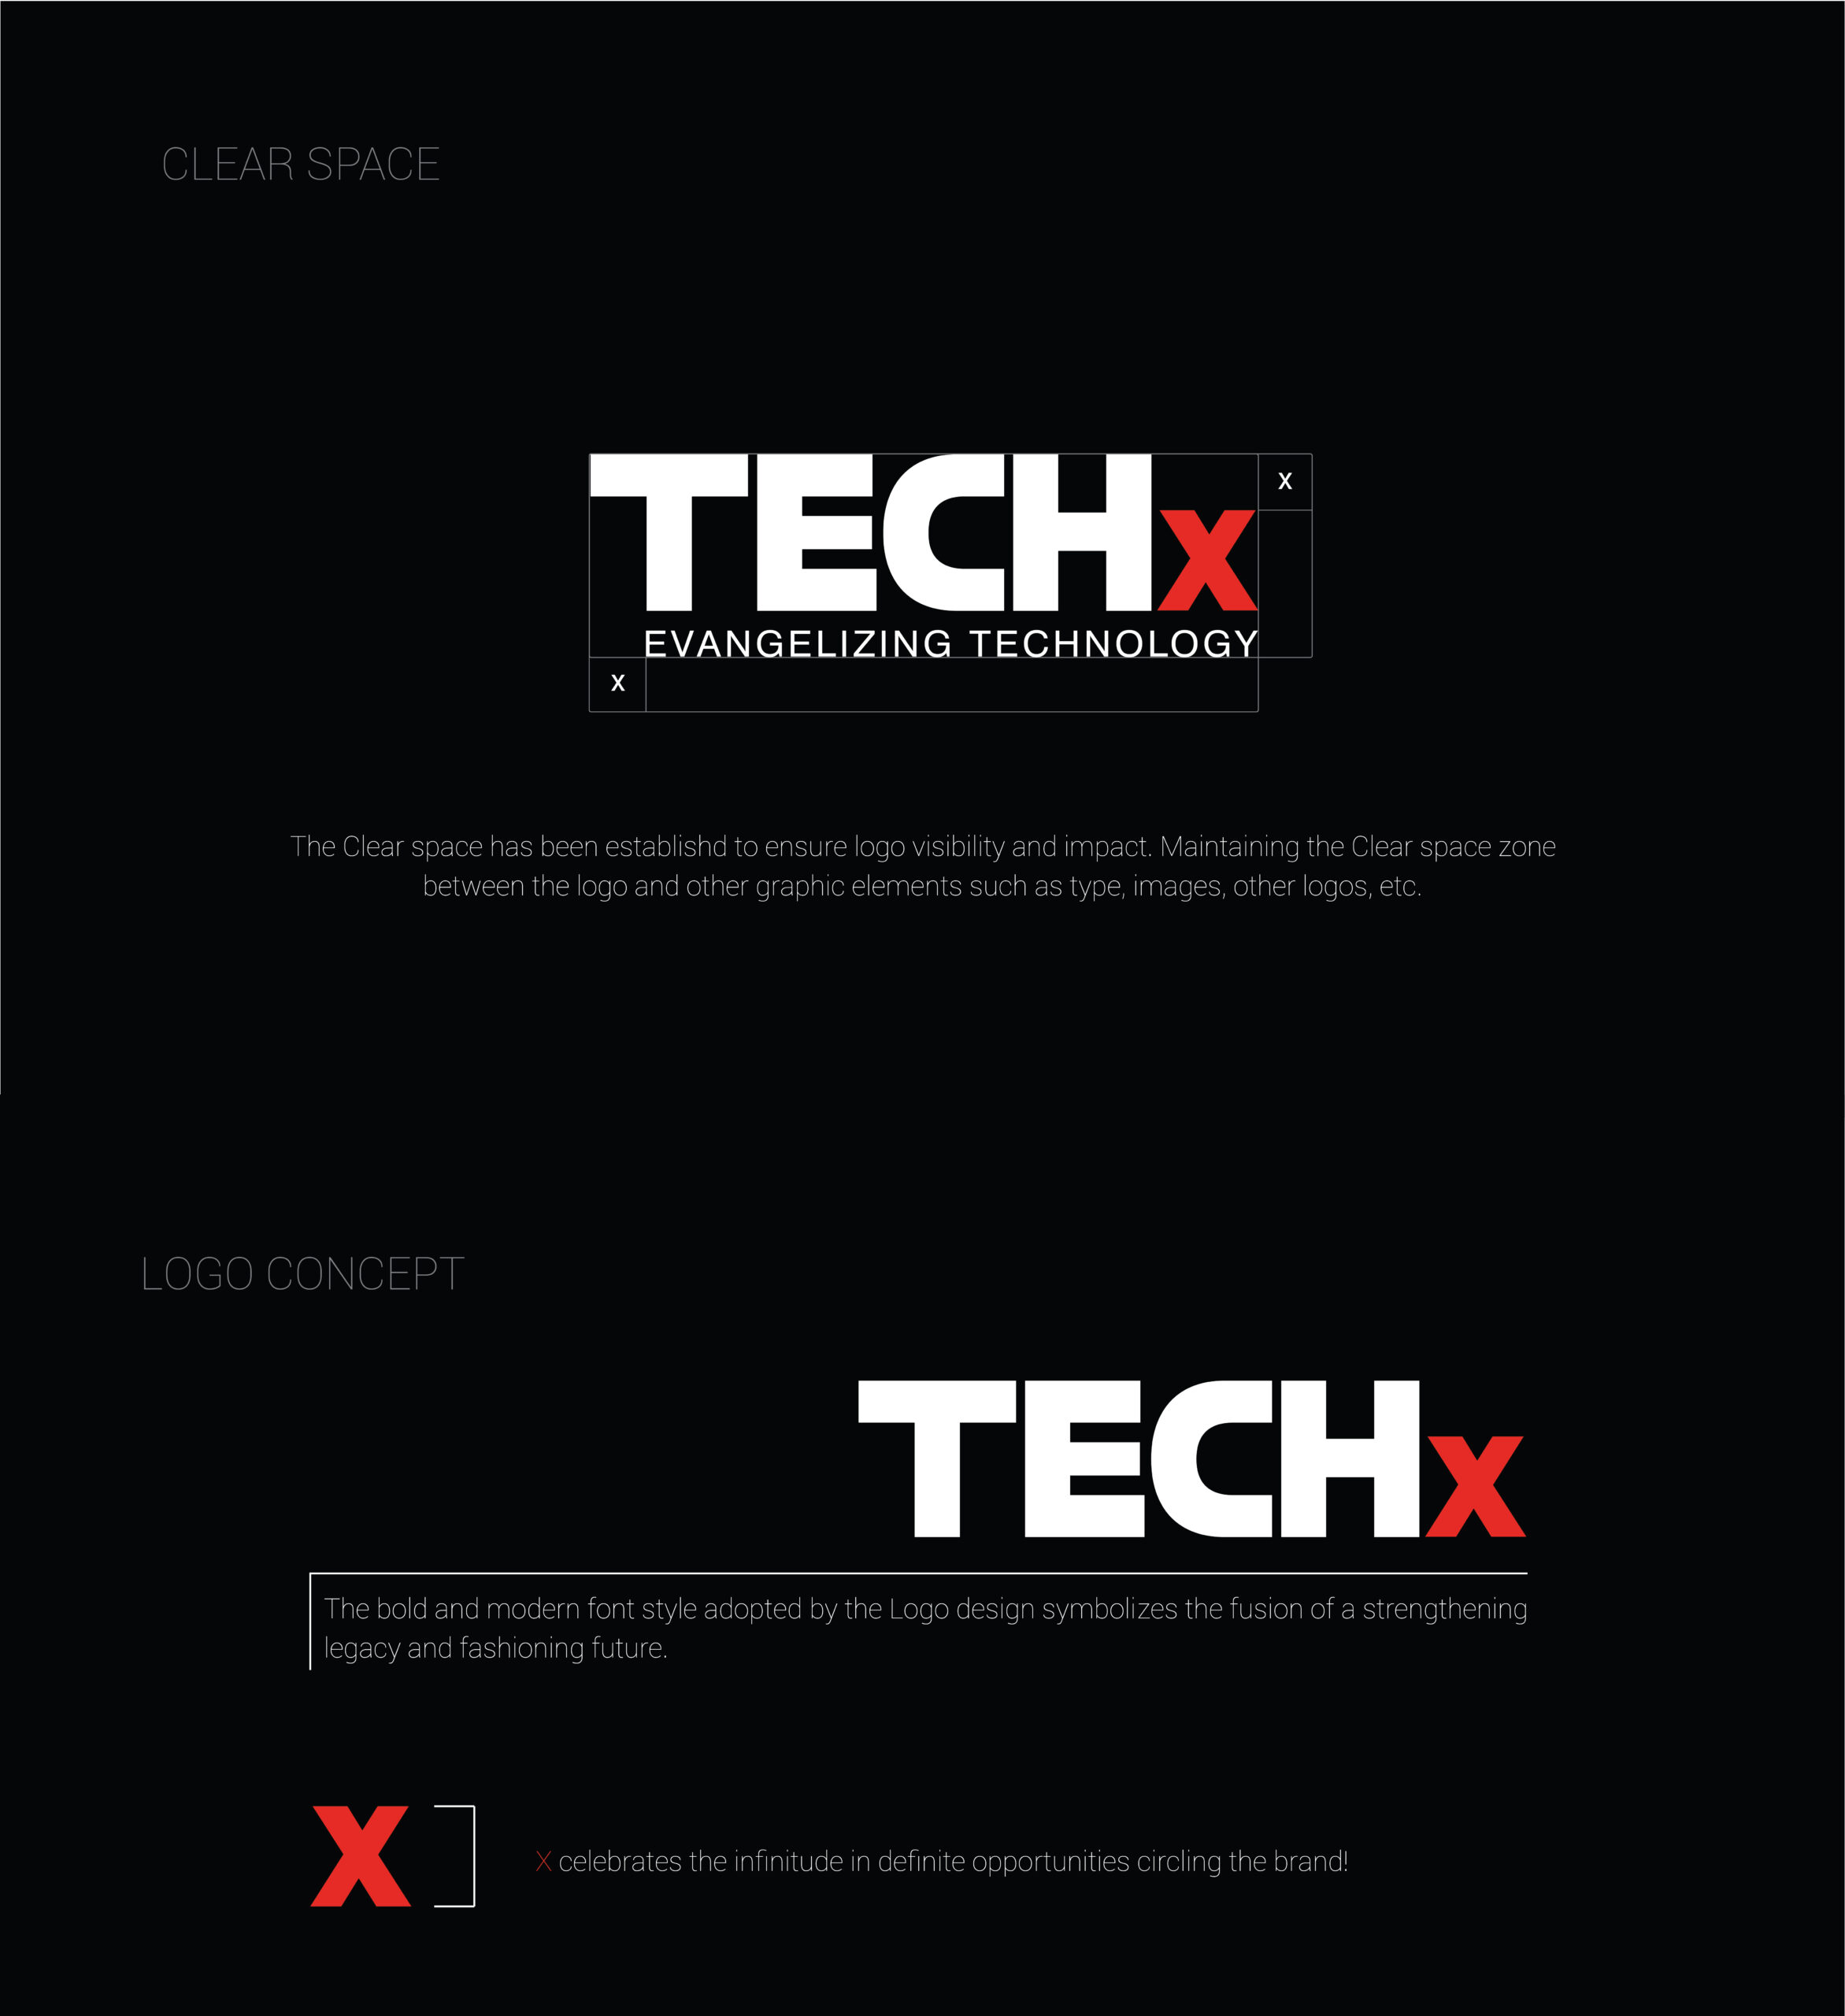
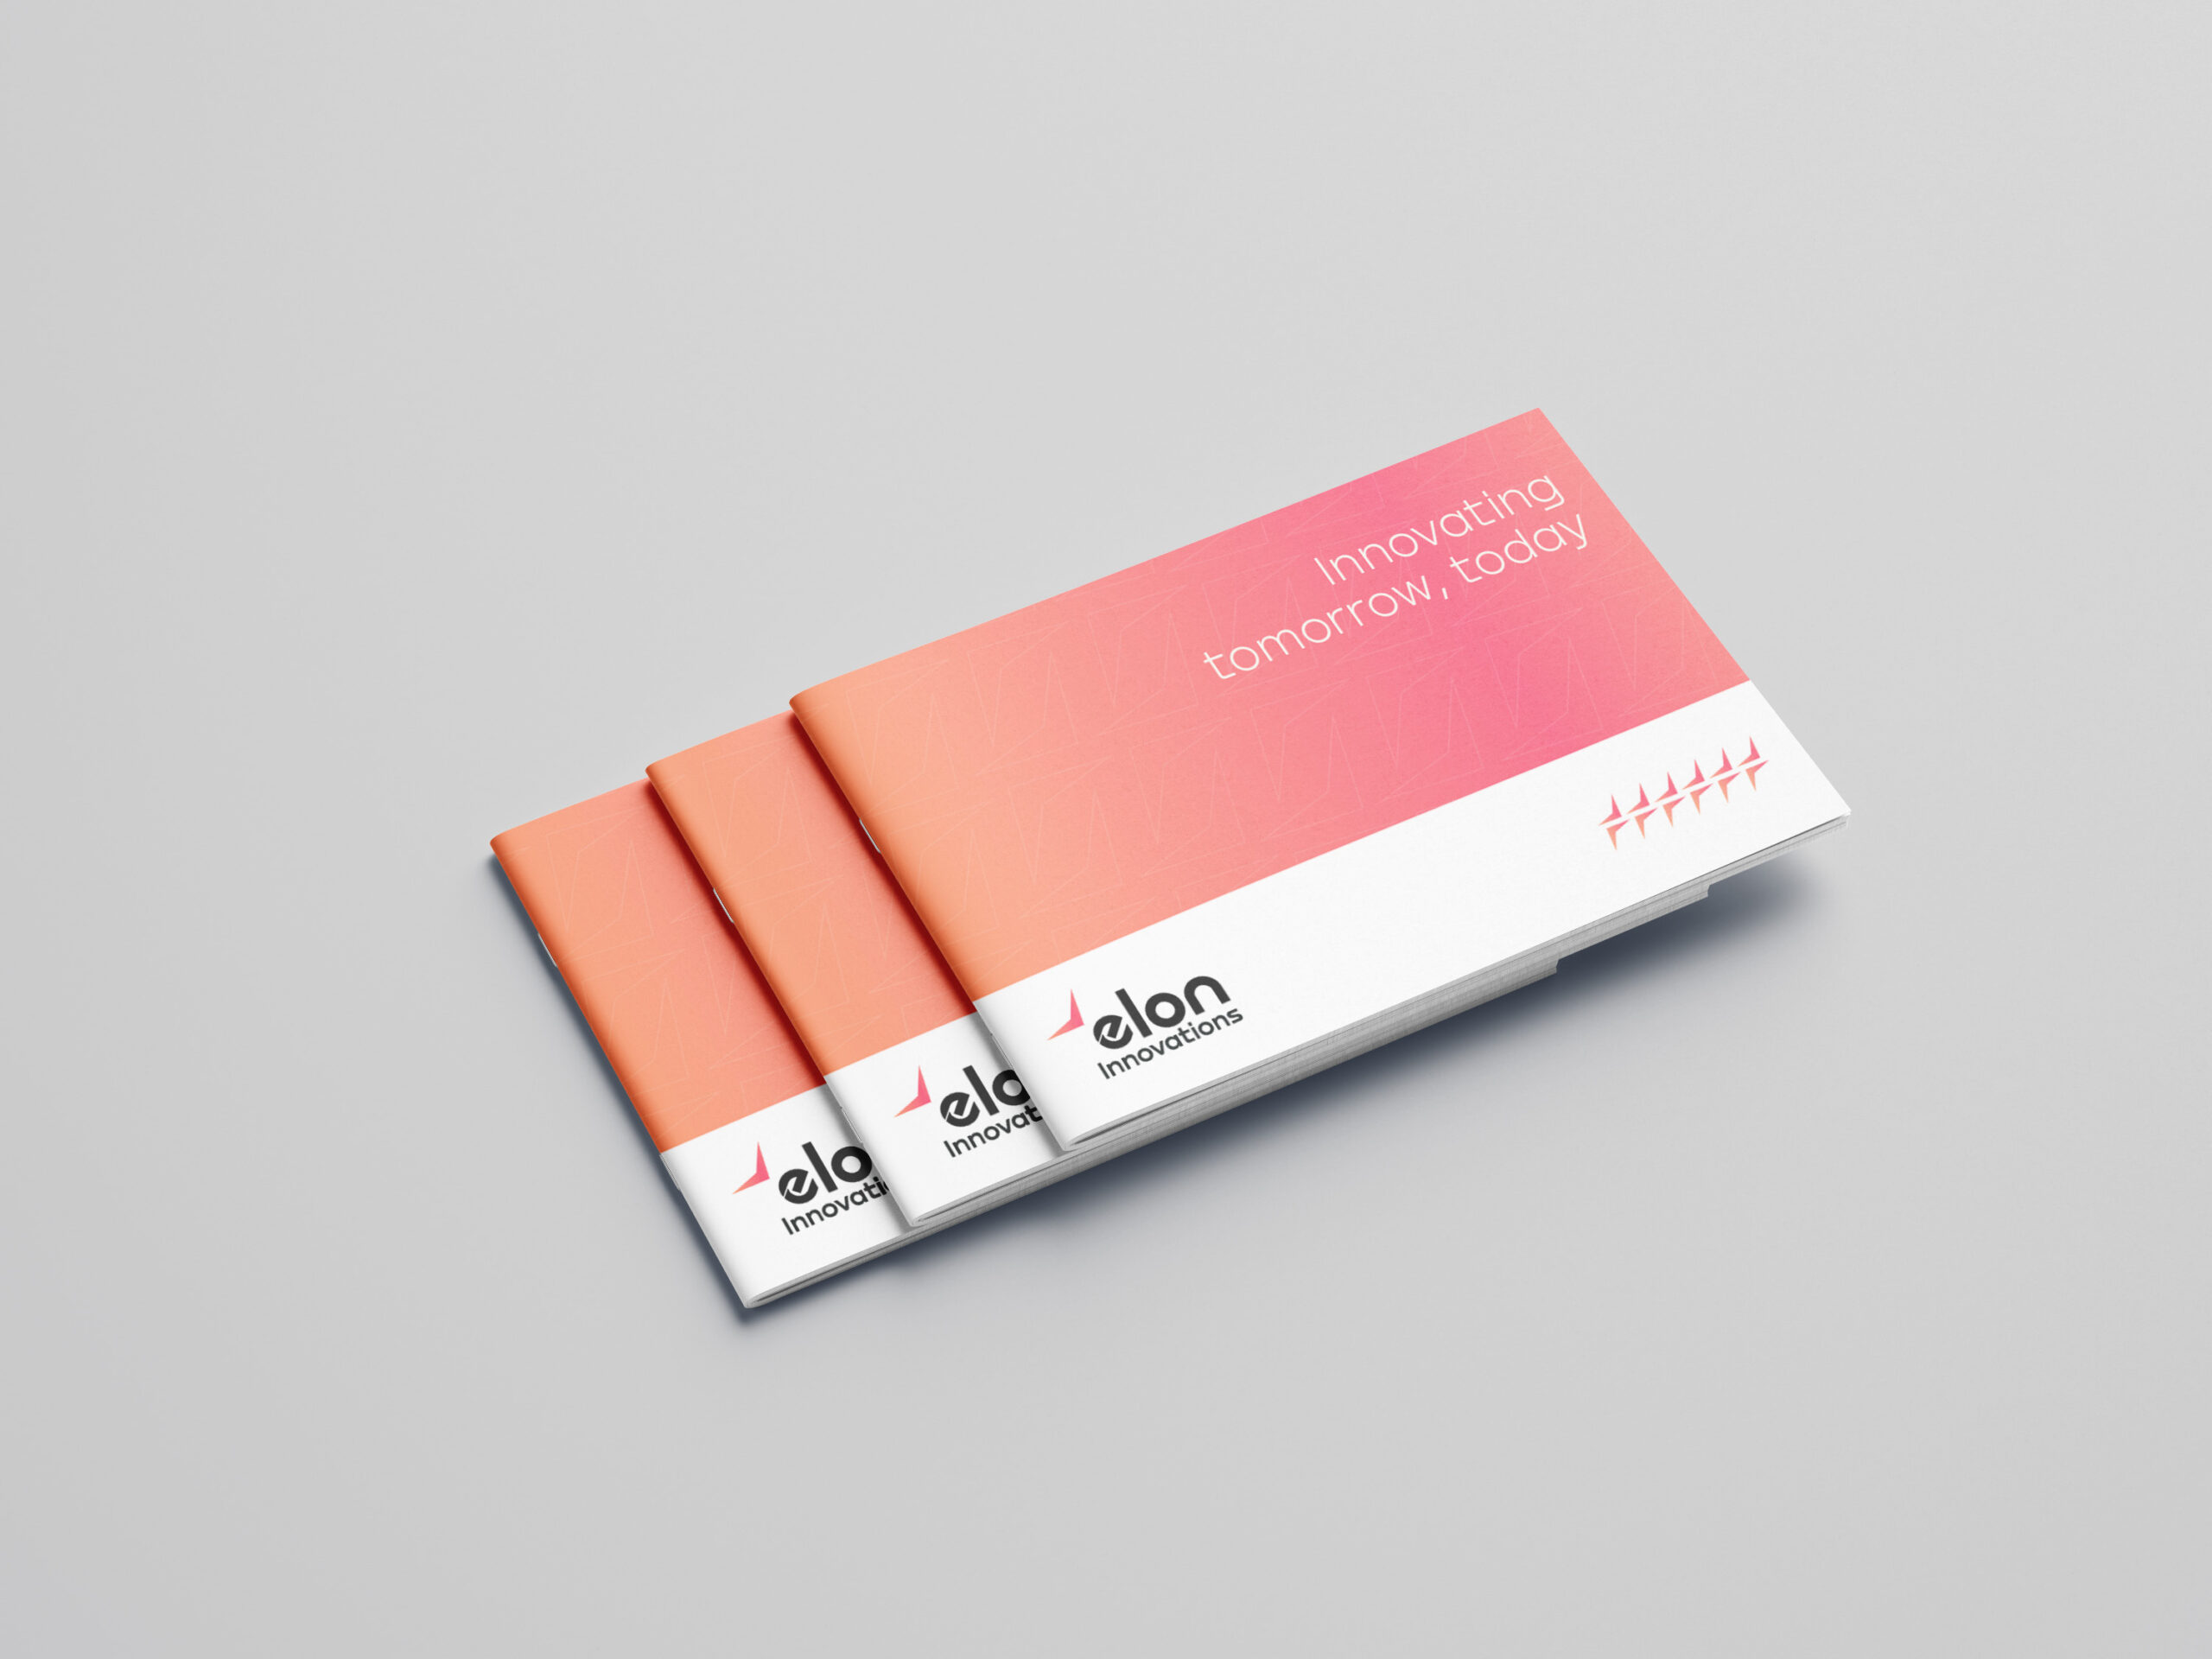
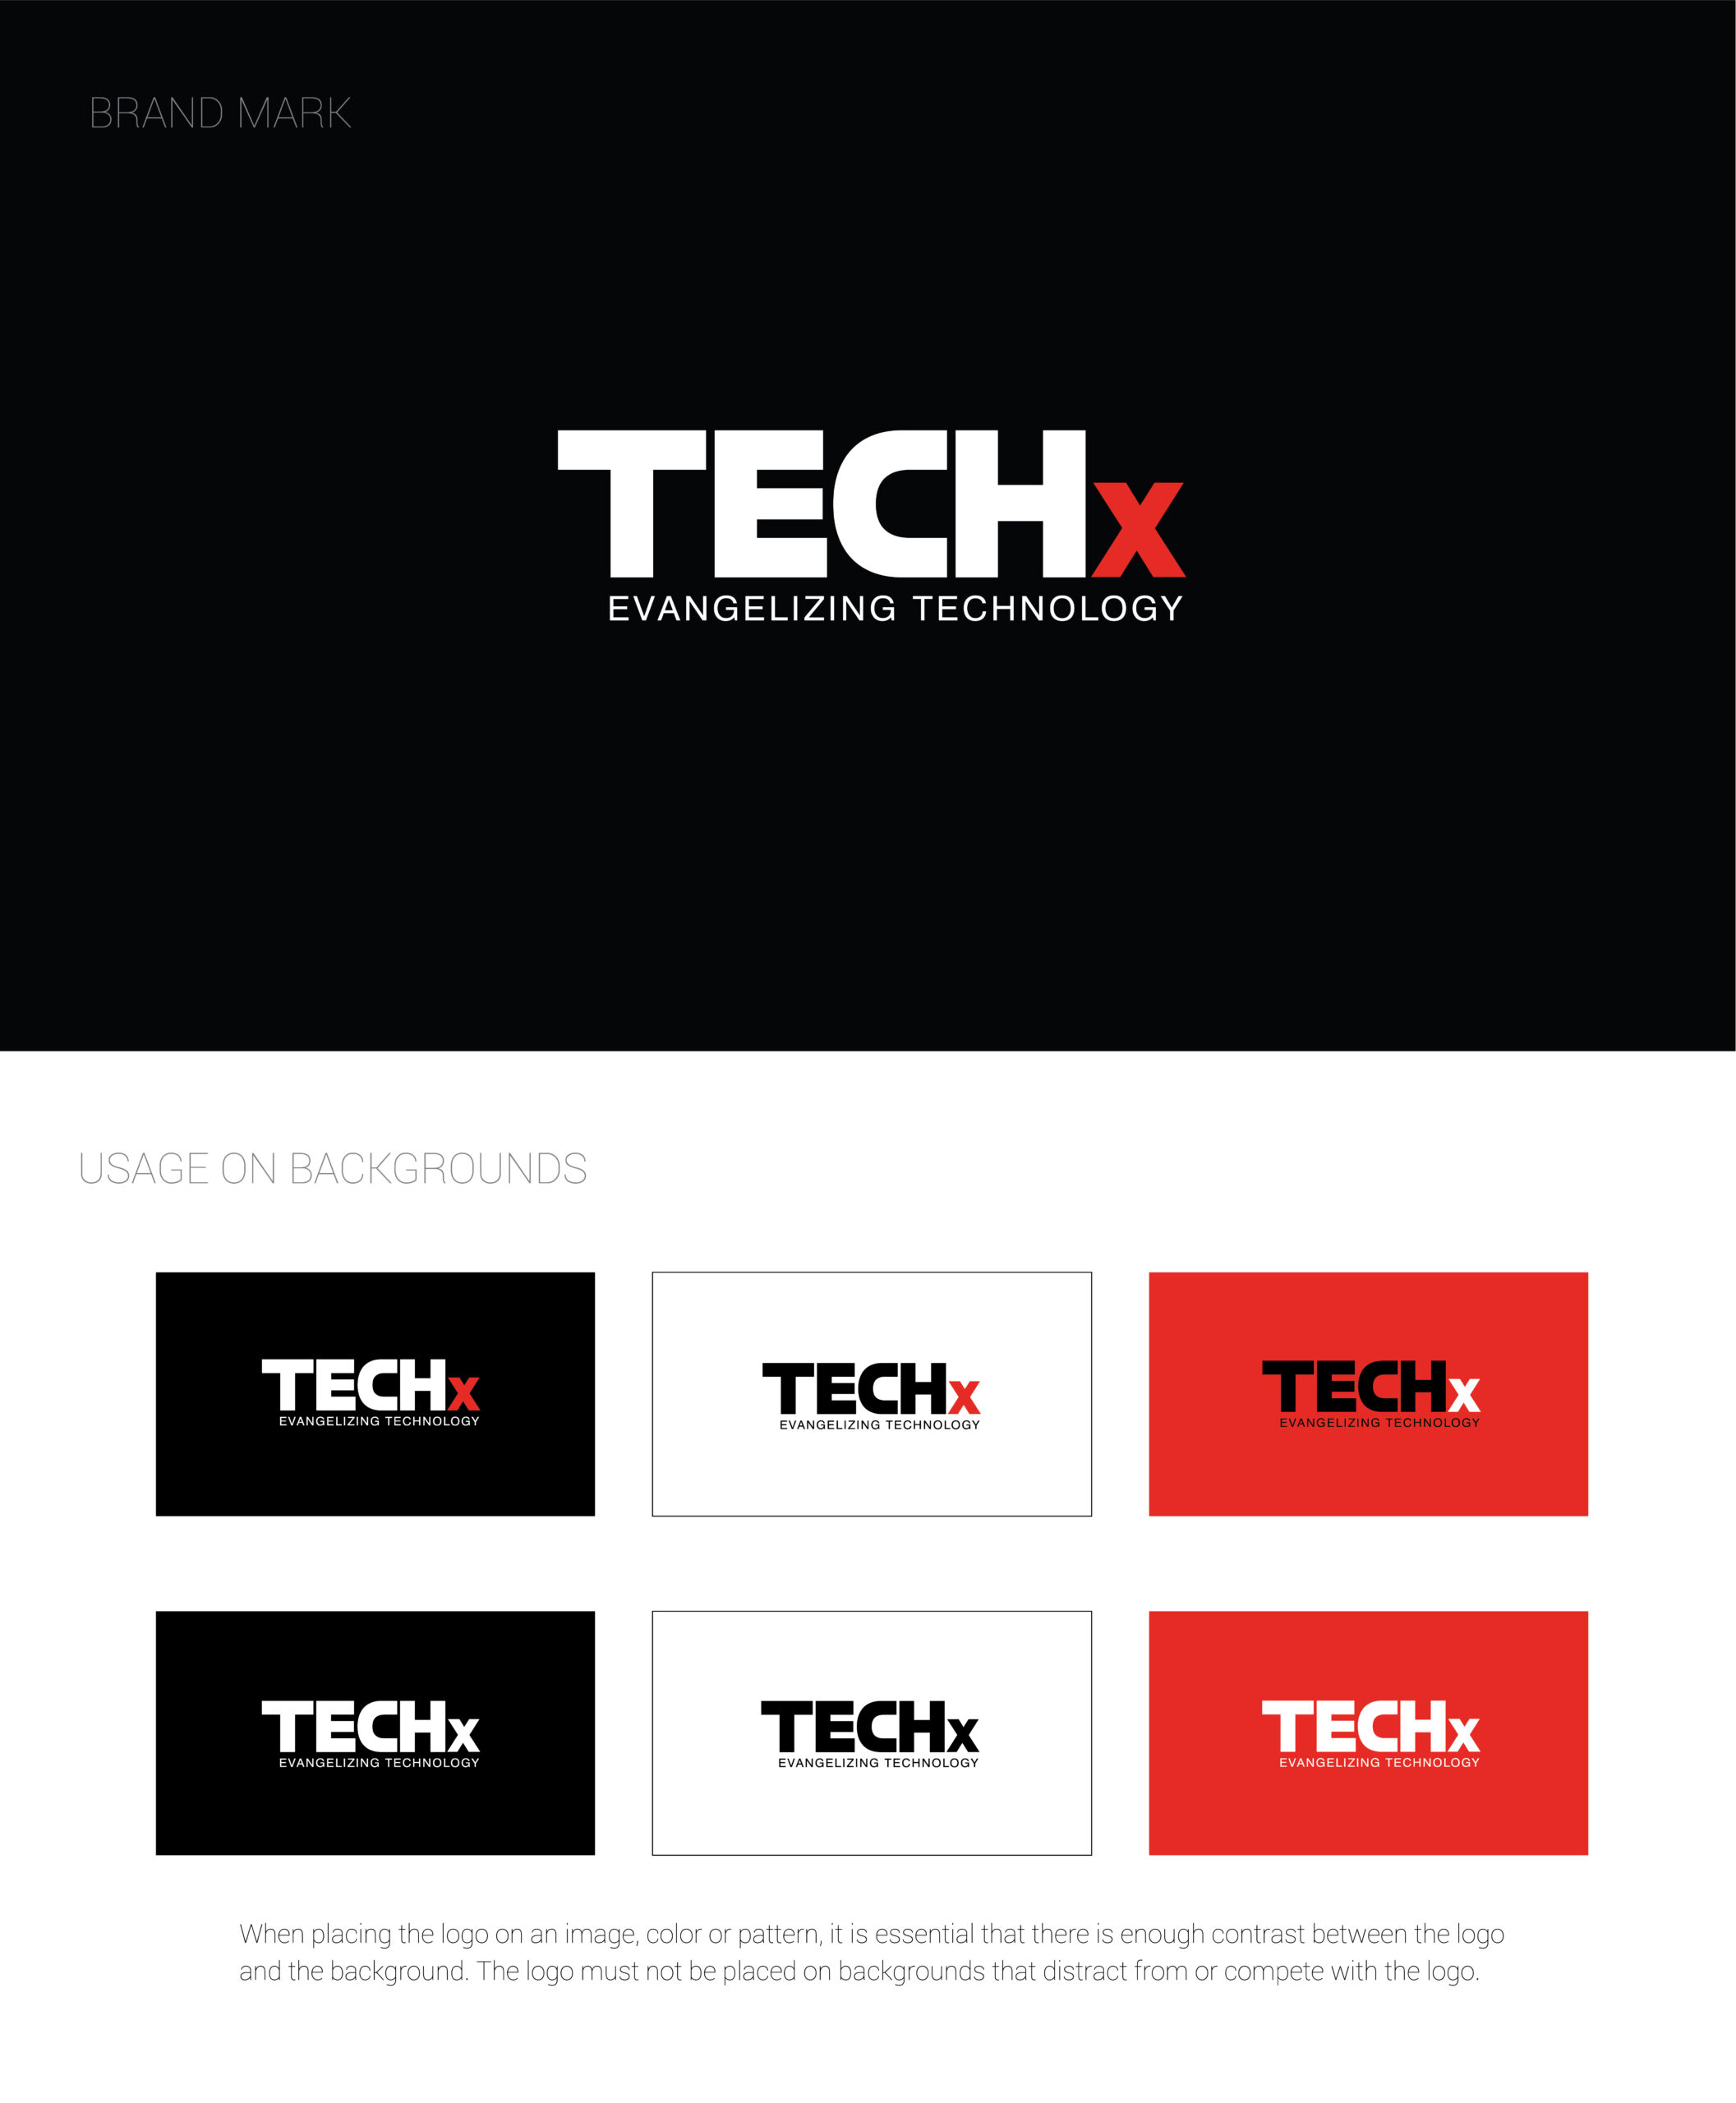
GRAPHICS UI/UX & PACKAGE DESGINING


Love our web designer portfolio? Let’s collaborate!